Unemployment declined in February 2015 for the second straight month, to 11.42%. This is the lowest unemployment has been in the US since June 2009, when unemployment was 11.26%.
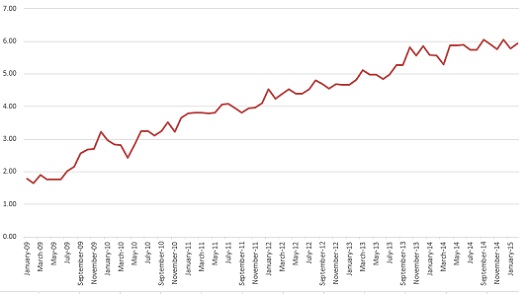
The Reporting Gap, which indicates how under-reported the official BLS figure is when failing to account for departures from the labor force, crept up to 5.92%, the third-highest rate to date. This puts the gap at nearly 108% of the reported figure, demonstrating that the BLS is ignoring 52% of those who are actually unemployed.
Unemployment in the US has been above 11% for 70 consecutive months. It has been above 10%, the highest reported figured by BLS during the Great Recession, for 72 consecutive months (six full years).
Here are your charts:
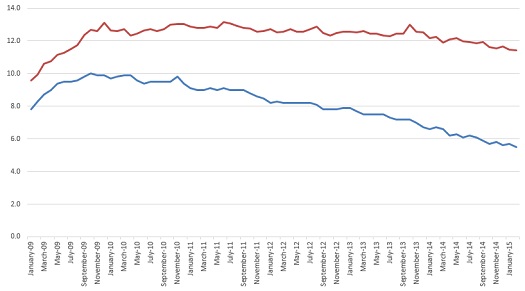
Unemployment in February was down 0.05% from January’s 11.47% and down sharply (0.24%) from December’s 11.66%. These are the most substantial improvements that have been demonstrated since late 2013, when unemployment fell below its spike in October 2013 to over 13%. Current trends seem to indicate that no one is re-entering the labor force, but those who have remained in the labor force are actually finding jobs at a slightly steadier pace at the outset of 2015. If these trends of improvement continue, unemployment may actually be below 10% by the end of 2016.
This is part of a continuing series on the under-reporting of unemployment in the United States of America.
Past posts (months indicate the month being analyzed – the post is in the month following):
December 2014 – labor force participation assessment
December 2014
November 2014
October 2014 – age assessment
October 2014
September 2014
August 2014
April 2014
December 2013 – seasonal assessment
December 2013
March 2013*
August 2012*
July 2012* – age assessment
July 2012*
*My initial analyses led to a slight over-reporting of the impact of the reporting gap, so the assessments in these posts are inflated, as explained and corrected in the December 2013 analysis.