What I predicted in April 2013 has finally happened.
The BLS released their September report on unemployment today, announcing that unemployment had dropped from 6.1% to 5.9% in the United States. Unemployment did drop between August and September, when accounting for those unemployed by virtue of not being in the labor force, but by a much more modest margin, from 11.99% to 11.94%.
11.94% is tied for the lowest unemployment rate in the US in five years, dating back to August 2009. Unemployment then was only 11.76%, but was reported as 7.9%. Things in August 2009 were slightly better than they are now, but people perceived them as being 33% worse. Although it may not be fair to say things were holistically better, because unemployment was starting to skyrocket toward its peak of 13.17%, while recently the trend is decidedly flat. Unemployment has been between 11.94% and 11.99% for four straight months, and between 11.94% and 12.17% since February.
The gap between the reported figure and the real figure hinges on this insidious quote from the BLS report out this morning:
“The civilian labor force participation rate, at 62.7 percent, changed little in September.”
The way that should be phrased is more along the lines of: The civilian labor force participation rate hit a new Great Recession low at 62.7 percent in September, reflecting that more people have now left the labor force since 2007 than are currently considered officially unemployed.
It’s easy to say that things are “little changed” when they dip 0.1%, even if that reflects a new record low. The problem is that 0.1% of the labor force-eligible population is 248,446 people. The alleged decline in unemployment of 0.2% month over month was 329,000 people. So a substantial majority (76%) of the people who allegedly stopped being unemployed actually just left the labor force. Thus the real unemployment rate was only down 0.05%, not 0.2%.
Here are your graphs for this month:
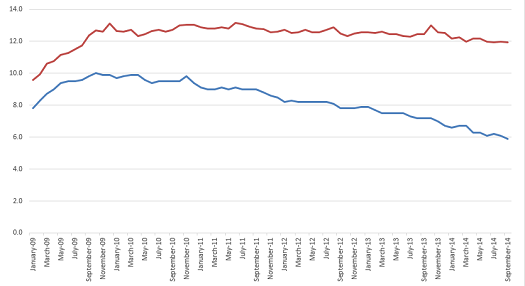

I decided to cut the graph to starting in January 2009 instead of January 2007 as I have in the past, mostly to emphasize the contrast and let the recent trends stand out a little more.
The Reporting Gap, or what I’ve dubbed the “Crazy Factor”, hit an all-time high last month with today’s report, and now finally stands higher than the reported figure in unemployment. The Reporting Gap is 6.04%. Unemployment is reported as being 5.9%.
Put another way, 9,262,000 Americans are currently unemployed by virtue of counting in the official statistics. An additional 9,481,787 Americans have either left or never been able to enter the labor force and are currently unemployed by that circumstance. These people have no jobs and, unlike the officially unemployed, no income.
The total number of unemployed Americans is more than double what we think it is. It is 18.75 million people, not 9.25 million.
If you’re wondering, the last time the labor force participation rate was this low, it was in February 1978. At the time, there was still a significant gender gap in terms of women being expected and/or able to work, as well as a burgeoning economic crisis. But the BLS is content to call a 36-year low in labor force participation “little changed”.
In fact, maybe the starkest graph I could show you is this one, from the BLS website itself, with no extra analysis on my part:
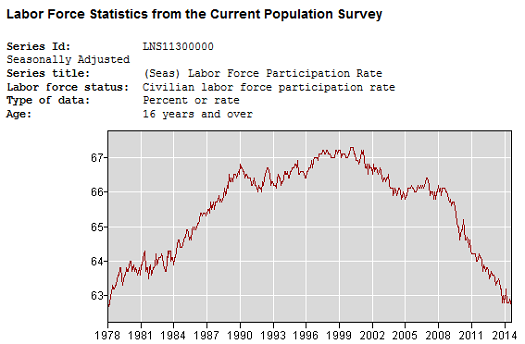
Does that look like a recovery to you?
This is part of a continuing series on the under-reporting of unemployment in the United States of America.
Past posts (months indicate the month being analyzed – the post is in the month following):
August 2014
April 2014
December 2013 – seasonal assessment
December 2013
March 2013*
August 2012*
July 2012* – aging assessment
July 2012*
*My initial analyses led to a slight over-reporting of the impact of the reporting gap, so the assessments in these posts are inflated, as explained and corrected in the December 2013 analysis.