I’m not the only person talking about the people who have left the labor force in the last ten years. It’s a hard story to ignore, though most of the media is up to this challenge. But CBS and the Washington Post have actually run recent articles on this issue, though none of them go so far as to actually include these people in a real unemployment figure like I do. Many people have attributed the shift entirely or largely to the aging population in the United States, to the fact that Baby Boomers are retiring and leaving the workforce.
This is bunk.
I examined this issue very lightly in August 2012. But since that time, I’ve come to understand the BLS reports and numbers much better and explored their very cool query tools for previous reports of their monthly Current Population Survey. So I drilled down into their reports and mined the data and put Excel to work on it. Who are the people who have left the labor force? How old are they? What can we infer from their age?
These people are young, not old. Less than half of them are Baby Boomers. Less than a quarter of them are Baby Boomers. Less than a tenth of them are Baby Boomers.
Just about 9% of them are Baby Boomers. Here’s your graph:
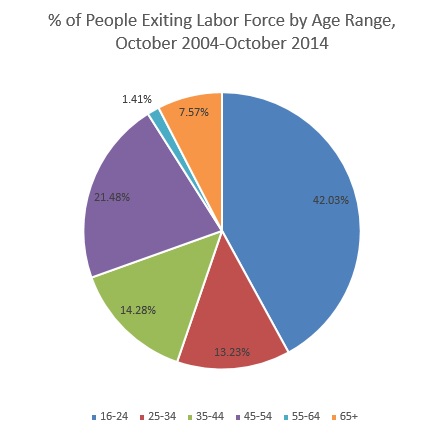
The graph represents about 7.5 million people who have left the labor force in the last ten years, since October 2004. Only 7.5%, or a little less than 600,000 of them, have “aged out,” crossing the magic threshold in our nation of 65 years. While 42% of them (nearly 3.2 million people) are younger than 25.
But wait, you are saying. Everything in the world is telling you that the American population is getting older, fast. Doesn’t it make more sense that all the people are just aging and thus leaving the labor force naturally, if not gracefully? How could this graph possibly be true when millions and millions of Americans are in fact aging out of the period of life in which we expect them to hold a job and earn a wage?
Yes, the American population is aging. But that growing population is increasingly staying in the workforce as it ages. The growth in the overall population of the older portions of the populous is being outpaced by the percentage of people staying in the labor force. In simpler terms, Baby Boomers are holding onto their jobs longer and preventing younger people from taking those jobs.
Here’s what this graph looks like:
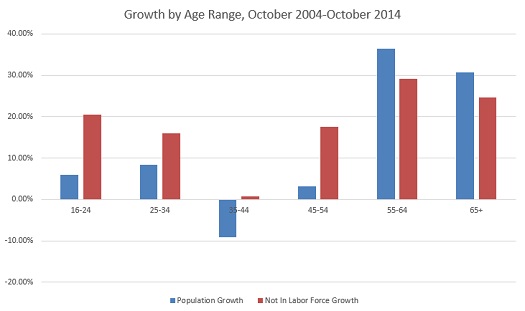
So even though the oldest age groups are growing steadily, most of the people who are aging are actually staying in the labor force into that age. Some of them are retiring and thus leaving the labor force, but a far smaller number than are leaving the labor force aged 16-54.
Perhaps the most amazing stat in that graph is the crash in population aged 35-44, reflecting a very small population in late Generation X. While the number of people that age has actually declined by 10% in the last 10 years, the number in that age outside of the labor force has somehow increased. This is why about a million more people of that age are now outside the labor force than would be had labor force participation rates remained constant.
So, about those labor force participation rates. Here’s what they look like:
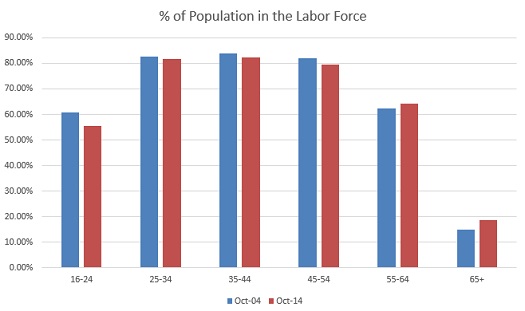
Even though the differences are small, this may be the easiest graph to see where the trends are headed. Only among those aged 55+ are labor force participation rates actually increasing. Meanwhile, the younger populations are consistently fleeing the labor force at the fastest rate. Which is why 42% of the people who’ve left the labor force (or more accurately, never entered the labor force) are under 25. Now nowhere are the rates increasing so much that it makes the population immune to the overall trend of people still leaving the labor force overall, numerically, though it’s close among those aged 55-64. Most of these people are working and many of them would have retired and left the labor force in the old economy. Now, very few of them are doing this. Only a paltry 100,000 people in this age range have left the labor force of the 7.5 million who have left overall, that tiny sliver in the first graph.
So the old are keeping jobs longer, the young are not getting jobs, but everyone is having a harder time staying in the labor force across all age ranges.
This is not a picture of a normal aging and retiring population. Less than 10% of the overall story of labor force desertion is about that. Over 40% of it is about people who never got a single job and thus can’t be counted as unemployed. Sure, more of these kids are in school. But by spending money they don’t have on mountainous debt for getting a degree that does less for them in the labor force, I think we can safely count these 3.2 million people as heading for official unemployment. In the meantime, they’re just part of the Reporting Gap that makes our 11.7% unemployment pretend to be below 6%.
This is part of a continuing series on the under-reporting of unemployment in the United States of America.
Past posts (months indicate the month being analyzed – the post is in the month following):
October 2014
September 2014
August 2014
April 2014
December 2013 – seasonal assessment
December 2013
March 2013*
August 2012*
July 2012* – aging assessment
July 2012*
*My initial analyses led to a slight over-reporting of the impact of the reporting gap, so the assessments in these posts are inflated, as explained and corrected in the December 2013 analysis.