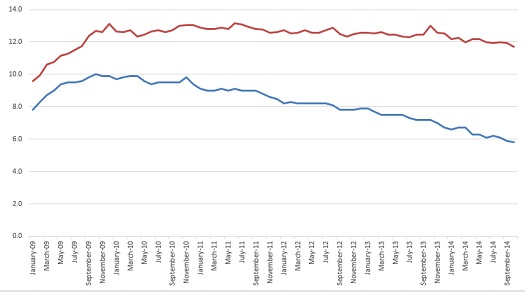
Unemployment in the United States dropped precipitously in October 2014 according to this morning’s report issued by the Bureau of Labor Statistics (BLS). The report shows that actual unemployment dipped by almost a quarter-percent month-over-month, declining from 11.94% in September to a five-year low of 11.71% in October. This is the lowest US unemployment rate since July 2009, when national unemployment was 11.53%.
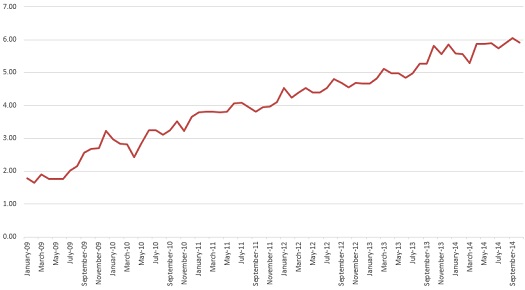
The reported official figure declined to 5.8%, keeping actual unemployment over double the official figure for the second month in a row. The Reporting Gap declined to 5.91% from its all-time high last month of 6.04%.
Actual unemployment is measured by including workers who are not in the labor force but normally would be during a time of economic health. These include both people who have left the labor force and, increasingly, those who have never been able to enter the labor force and thus are ineligible for official unemployment classification. Labor force participation edged up to 62.8% this month, beating a 36-year low of 62.7% from September.
This graph shows unemployment rates, comparing the actual figure including those not in the labor force as opposed to the official reported figure:

And this shows the evolution of the Reporting Gap over the same period, demonstrating the distance between reality and what the media reports:

Unemployment remains noticeably above the highest figure reported during the so-called Great Recession. Reported unemployment peaked at 10.0% in October 2009 (when actual unemployment was 12.69%). Real unemployment peaked at 13.17% in June 2011 (when the reported figure was 9.1%). Since that peak, unemployment has dropped by only 1.46%, while the reported figure has declined by 3.3%.
Real unemployment has been in double-figures, which it was reported to be in only one month during the last five years, for 68 straight months.
This is part of a continuing series on the under-reporting of unemployment in the United States of America.
Past posts (months indicate the month being analyzed – the post is in the month following):
September 2014
August 2014
April 2014
December 2013 – seasonal assessment
December 2013
March 2013*
August 2012*
July 2012* – aging assessment
July 2012*
*My initial analyses led to a slight over-reporting of the impact of the reporting gap, so the assessments in these posts are inflated, as explained and corrected in the December 2013 analysis.


