Contrary to what you might imagine about the Bureau of Labor Statistics (BLS) and its record-keeping on the purported unemployment situation, they are fairly aware of the impact of the crashing labor force participation rate on the overall employment picture. And contrary to the joyous daze caused in most of the media by pronouncements that the unemployment rate is at a 6.5-year low of 5.6%, BLS even seems to realize that the labor force participation rate is going to continue to fall. More and more media outlets are picking up sour notes about the absurdly low-seeming unemployment rate and how it mostly reflects workers fleeing (or never entering) the labor force, rather than actually, y’know, getting jobs. Indeed, they have done reports on this very issue.
To channel Condoleezza Rice at a hearing here, I believe the report was titled Labor force projections to 2022: the labor force participation rate continues to fall.
Written in December 2013, the report makes the dire prediction that the labor force will plummet to 61.6% by the end of 2022. This number, of course, would be an over 2% drop from the attributed end of 2012 rate of 63.7% and continue to distort the unemployment figure drastically. Because not only are those 2% of the overall population people who would normally be counted toward unemployment, but unemployment uses the labor force as its denominator, meaning that the percentage of people with jobs looks higher because it is a percentage of the labor force, not the overall population. And if we keep excluding more and more jobless individuals from the labor force to begin with, the proportion of those with jobs in the remaining smaller section of the population will rise. When really those 2% of the populous should be counted as being in both the numerator and denominator, swelling the rolls of the unemployed drastically.
How drastically? By 108% last month alone, as I’ve reported. At least if we count all the people who’ve left or failed to enter the labor force since the advent of the so-called Great Recession.
61.6% certainly sounds bad, but similarly, 2022 sounds like a long time from now. A really long time from now. So how accurate is that prediction?
Well, we’re already halfway there. It’s been two years since the predicted starting point for that decade-long trajectory and labor force participation stands at a 36-year-low of 62.7%. We’ve dropped 1.0 points out of a total of 2.1 points in the predicted 10-year fall, in just a fifth of the time.
So I ran some numbers and graphs to see what kind of pace we’re on:
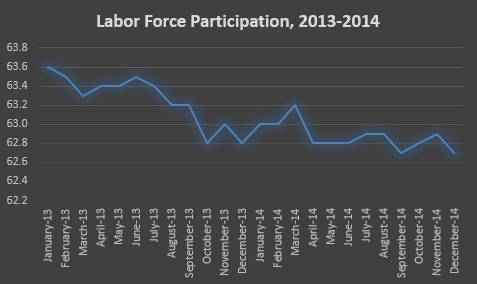
Looks bad, but a little up-and-down. Let’s put a trend-line on that:
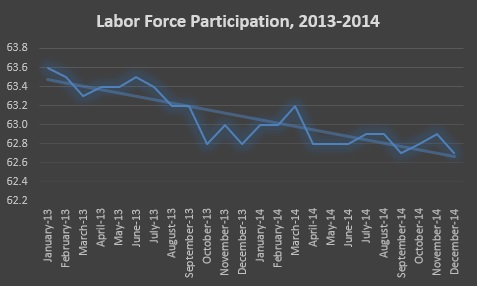
Now we can clearly see through the noise that there’s a steady pace of decline, that the general direction is down and what that rate is likely to be. So when do we hit 61.6%?
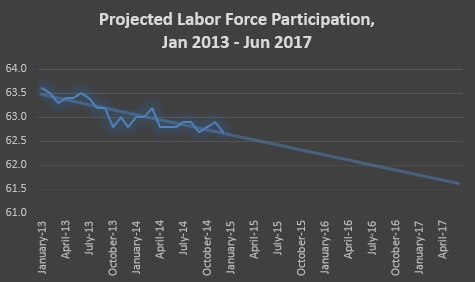
Roughly June 2017. Which is, uh, five and a half years before December 2022. Or a bit over twice as fast as predicted. 2.22 times as fast, if we’re being technical about it. But hey, give them the extra 0.22 times as margin of error, just in case my prediction is somehow too speedy.
Now, yes, their prediction algorithm is certainly more statistically sophisticated than my little trend-line. As they note at the end of their report, “In order to carry out its projections, BLS analyzes and projects the labor force participation rates of 136 different groups, including the two genders, 17 age groups, and four race and ethnicity categories.” I just used the overall population and ran with it, even though I probably have the tools to do a decently robust age analysis after what I put together a couple months ago.
But here’s the thing – I really don’t think they would have predicted it would take just two years to get to 62.7% and then another eight to get down to 61.6%. Or if they did, it feels like that decision was driven by irrationally exuberant optimism. The fact is that the employment picture has stymied every optimistic prediction, save for those of people unsophisticated enough to not look beyond the headline-published number and its allegedly precipitous decline. Unemployment is actually over 11.5%, not below 6%. We’ve just conveniently sidestepped reality by benefiting from a number that encourages people to be discouraged and leave the labor force entirely. And when BLS itself recognizes that this trend will continue, but seems too cautious in their ten-year projection, it feels like we should just stop talking about a recovery already. Or at least one that helps those below the very top shelf of our self-imposed economic structures.
This is part of a continuing series on the under-reporting of unemployment in the United States of America.
Past posts (months indicate the month being analyzed – the post is in the month following):
December 2014
November 2014
October 2014 – age assessment
October 2014
September 2014
August 2014
April 2014
December 2013 – seasonal assessment
December 2013
March 2013*
August 2012*
July 2012* – age assessment
July 2012*
*My initial analyses led to a slight over-reporting of the impact of the reporting gap, so the assessments in these posts are inflated, as explained and corrected in the December 2013 analysis.