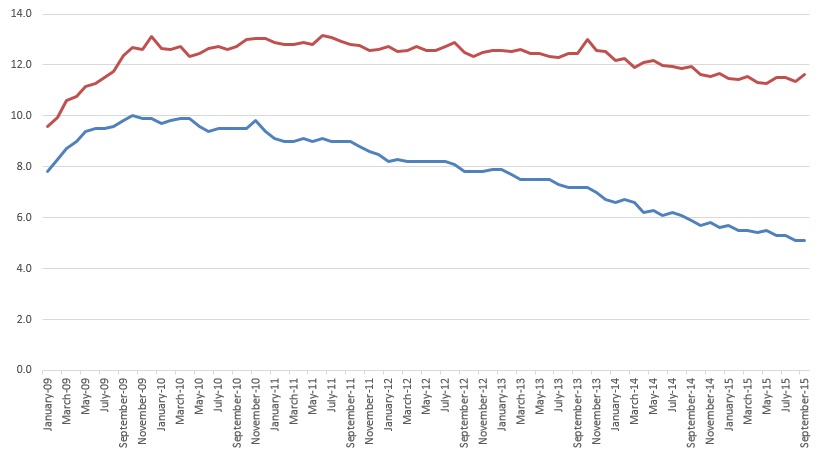
For every person listed as officially unemployed in yesterday’s jobs report, there are another 1.28 people who are really unemployed, but are not captured because they have left or never entered the labor force. In total terms, this means that 7,915,000 people are “unemployed” and another 9,140,784 are unemployed, but living in what I call the “Reporting Gap” where they cannot be seen by the official BLS numbers. These folks have either given up looking for work, were ineligible for unemployment because they’ve never had (and thus lost) a regular job, or have restructured their life outside of a legal job because they just don’t think it’s feasible for them. If our numbers were more honest, they’d show that over 17 million Americans are out of work, or 11.62% of the population.
Here are your charts:


Real unemployment is now at its highest rate since December 2014, when it was 11.66%. Unemployment has been above 11% for 77 consecutive months, since May 2009.
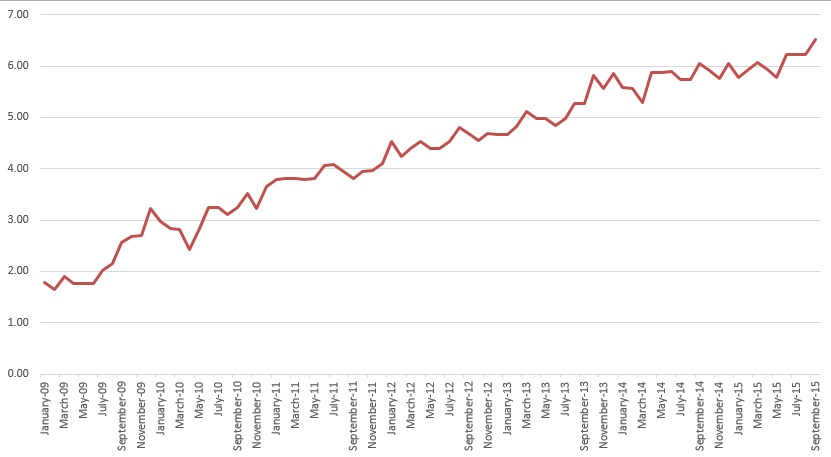
The Reporting Gap hit a record high of 6.52%, surpassing a record 6.23% from last month. It has been above 6% for four straight months, and above the reported unemployment rate for 10 straight months, since December 2014. This means that the official unemployment rate has been capturing less than half the unemployed for all of 2015.
I hasten to add that my real unemployment figure includes no one who is working part-time or less than they’d like to be. It includes no one who is working at all. Including people from that popular U-6 figure (currently 10%), would push the overall unemployment rate well above 15%. But I think U-6 unemployment, while capturing some job distress or under-utilization of the employment market, is far less accurate for the phrase unemployment than my figure, since people working even a couple hours a week are employed. Not one of the 17 million people I would call unemployed is working professionally (at least legally) so much as an hour a week.
This is part of a continuing series on the under-reporting of unemployment in the United States of America.
Past posts (months indicate the month being analyzed – the post is in the month following):
July 2015
June 2015
March 2015
February 2015
December 2014 – labor force participation assessment
December 2014
November 2014
October 2014 – age assessment
October 2014
September 2014
August 2014
April 2014
December 2013 – seasonal assessment
December 2013
March 2013*
August 2012*
July 2012* – age assessment
July 2012*
*My initial analyses led to a slight over-reporting of the impact of the reporting gap, so the assessments in these posts are inflated, as explained and corrected in the December 2013 analysis.


