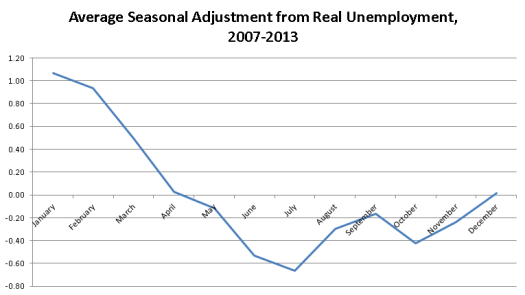
I was curious to analyze the seasonal adjustment data after the last post I made about unemployment data and under-reporting from 2007-2013.
Basically, seasonal adjustment follows a similar shape every year. Not the exact same shape, which is interesting, but my initial inclination to post the graph of each of the years from 2007-2013 individually wound up looking like a well-tread rut line with a couple of alterations high and low in weird outlier months. So the average of the last seven years seems more useful in looking at what’s really going on with unemployment as it cycles through the months.
I realize I may have done this graph upside-down from what you’d expect – being high on this graph means that actual unemployment (i.e. not seasonally adjusted) is that much higher than the reported seasonally adjusted rate, whereas lower means that the actual unemployment is lower than what’s reported. In other words, in the average January, BLS is shaving a percentage point off the unemployment tally, while in July, they’re adding about 0.6%.
Unsurprisingly, July is the best time to get a job. There’s seasonal work, more people (mostly young whipper-snappers) enter the job market, the weather’s good, people are buying ice cream. Okay, so it’s mostly seasonal work. Summer camp opens and teachers aren’t considered unemployed during their well-earned rest. Everybody celebrate.
January, by contrast, is a disaster. I think December would be too, except there’s seasonal work there to combat that as retailers add tons of temporary workers for the Christmas rush, making that and April the statistically least adjusted months. Basically, winter is bad, summer is good, and fall kind of bumps along being okay.
This is a footnote to all my other posts about how crazy you should feel when the numbers come out. It’s also a really bad sign about what’s going on right now in the economy, because ain’t nobody hiring in January. The numbers are going to take a point off the figure, plus all the people I’ve discussed who are coming off unemployment with Congress putting them off long-term benefits. So we’re in for a heck of a gap this month between what’s reported and what’s real. Honestly, the report could say that January unemployment is 5.5% and that the US lost jobs. That’s probably about what’s going to happen.


